AIR User Guide
The Archaeological Interactive Report (AIR) is a web-based platform for the documentation, management, visualisation, and publication of archaeological investigation data.
AIR brings together different types of archaeological documentation within a single environment, including metadata, images, videos, geographical information, and 3D models. It supports both the exploration of excavation data and the presentation of archaeological interpretations through interactive digital reports.
1. The AIR Homepage
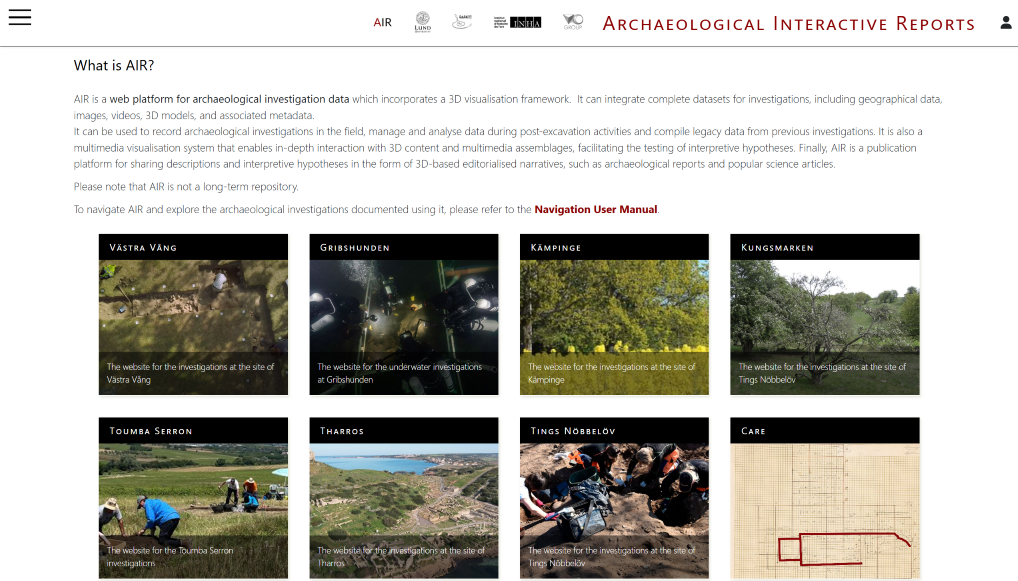
The AIR homepage is the main entry point to the platform. It provides access to multiple archaeological project websites, each representing a distinct dataset. From this page, users can select a project and begin exploring its excavation data. The top navigation menu also provides access to general tools such as Browse, Search, and the User Manual. Each project site contains its own structure and content, but all follow a similar logic of navigation through campaigns, reports, and related data.
2. Click on a project title or image to enter the site
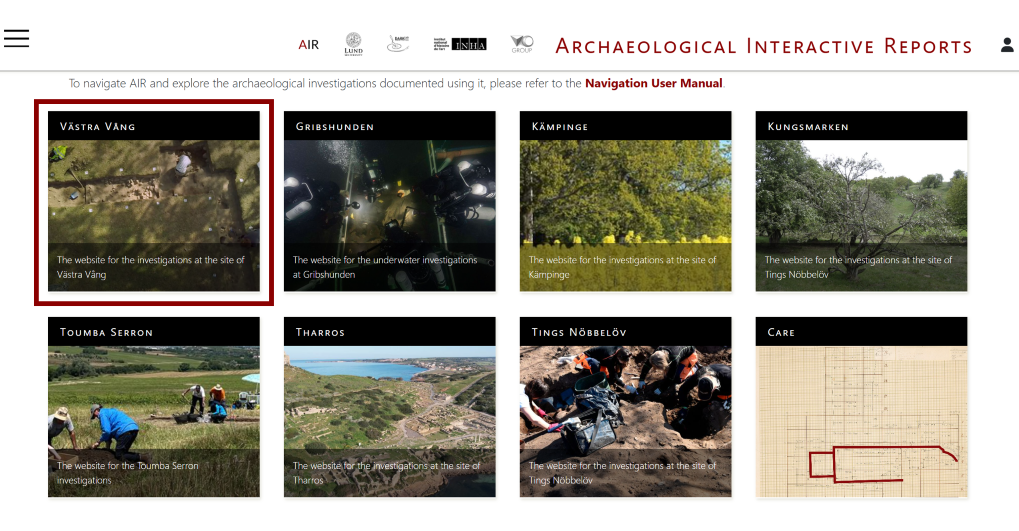
After selecting a project from the AIR homepage, users enter a dedicated project website. Each project represents a specific archaeological excavation or research initiative. While each project contains different data, all project websites share a similar structure. The main navigation menu provides access to the core components of the dataset. Common sections include Campaigns, Reports, Browse, Search, and Indexes. These sections allow users to explore excavation data from different perspectives, depending on their needs.
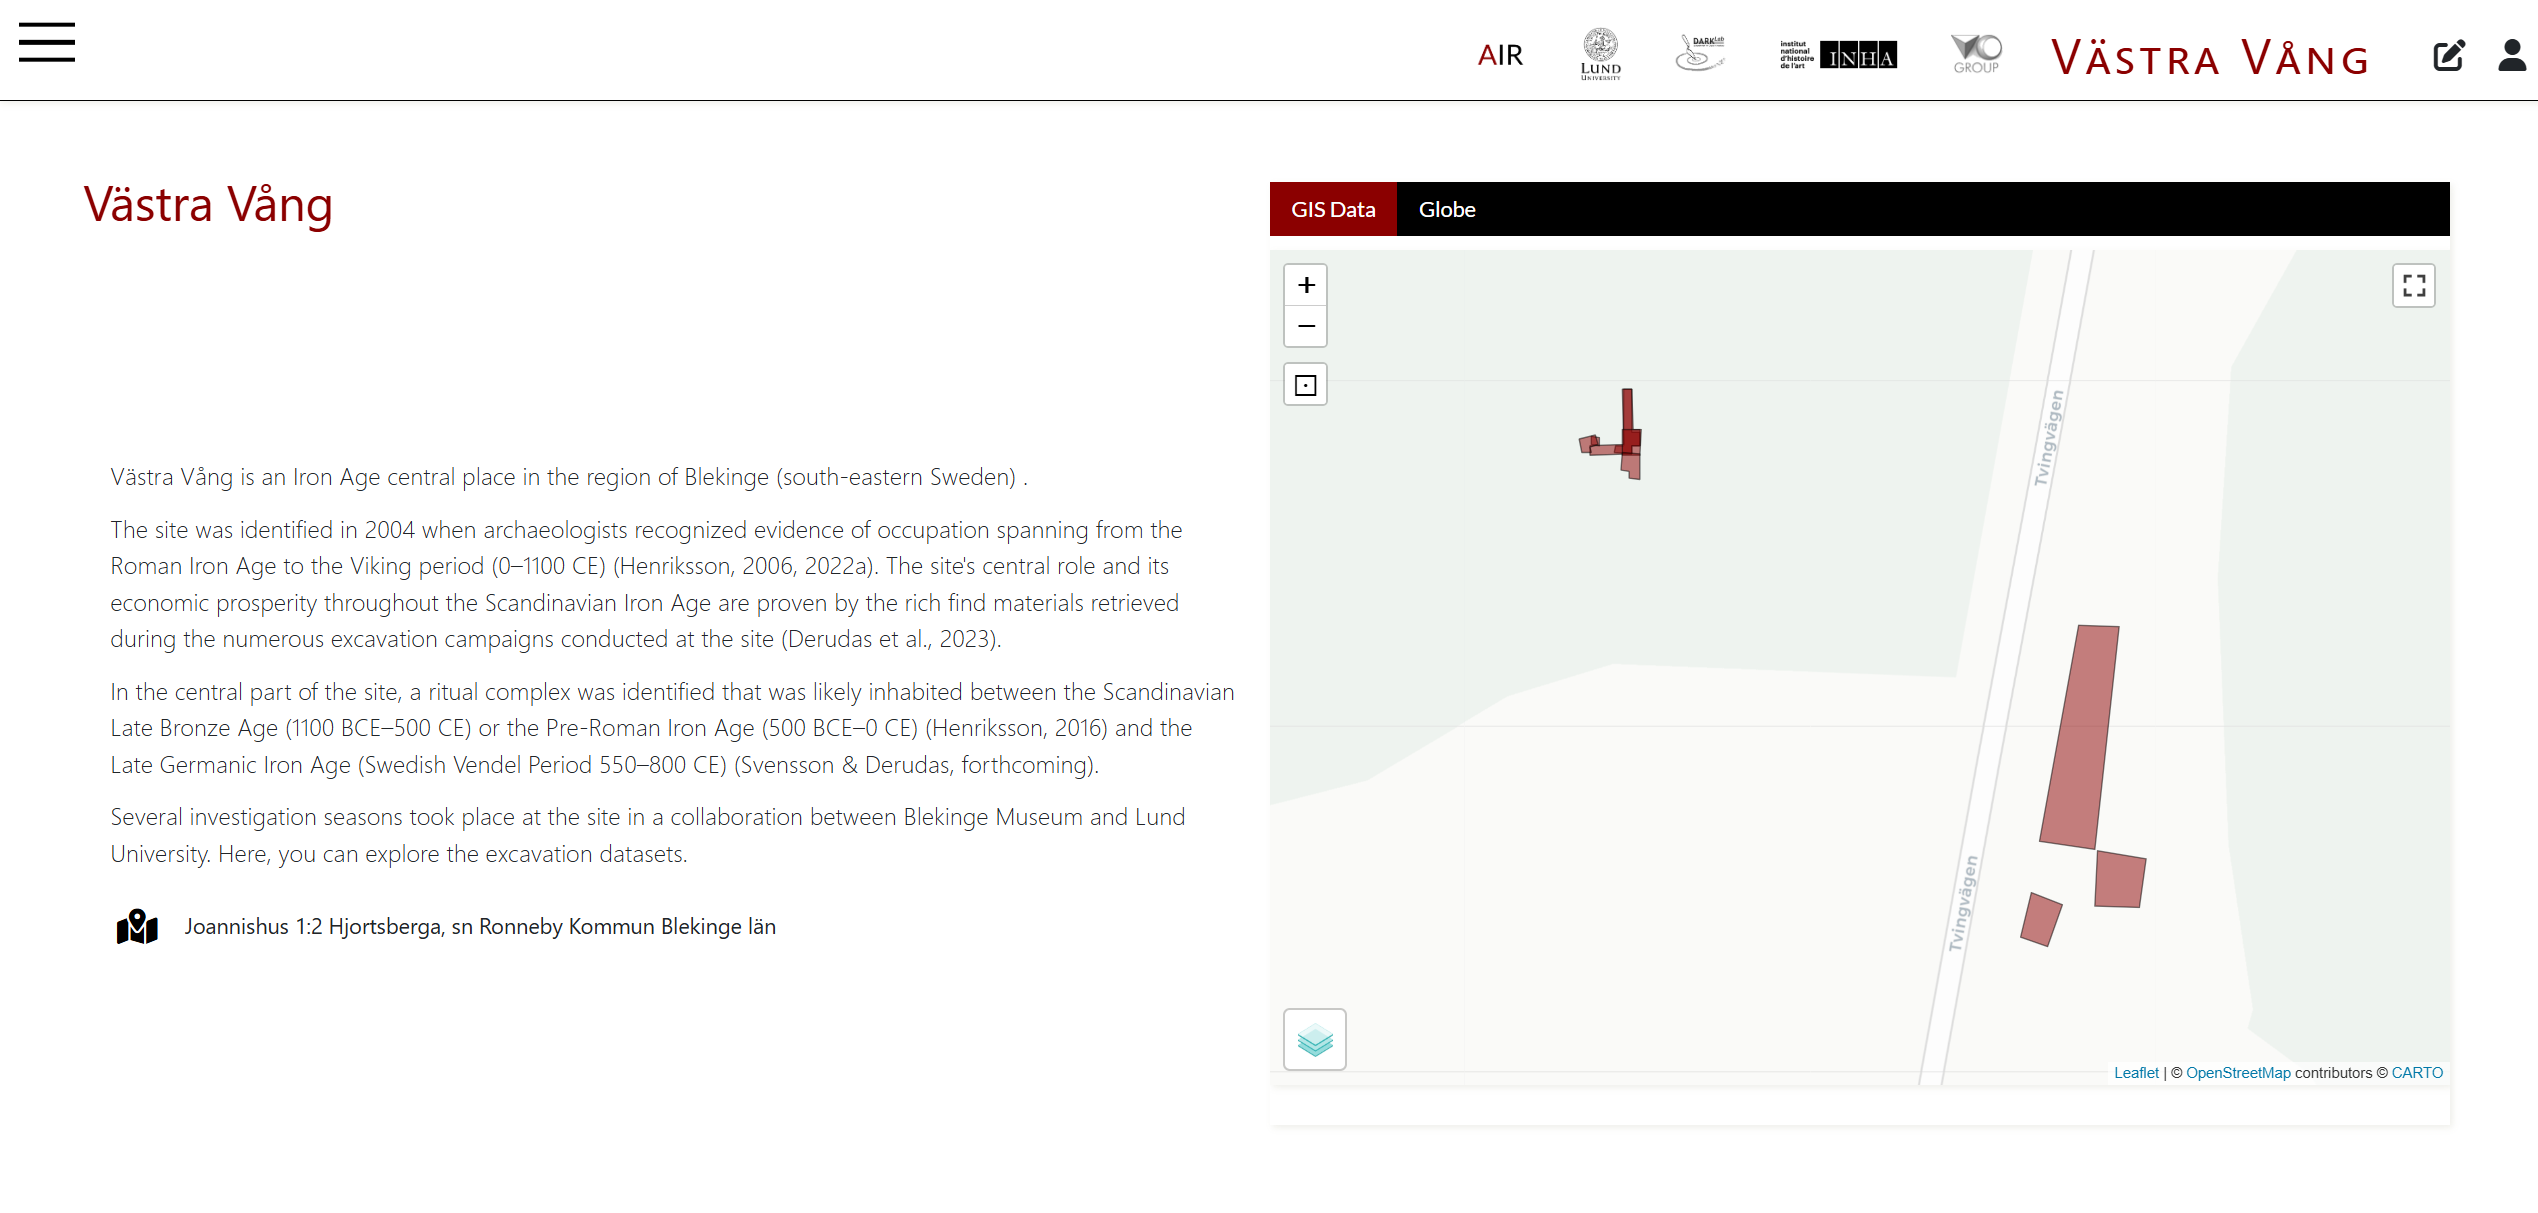
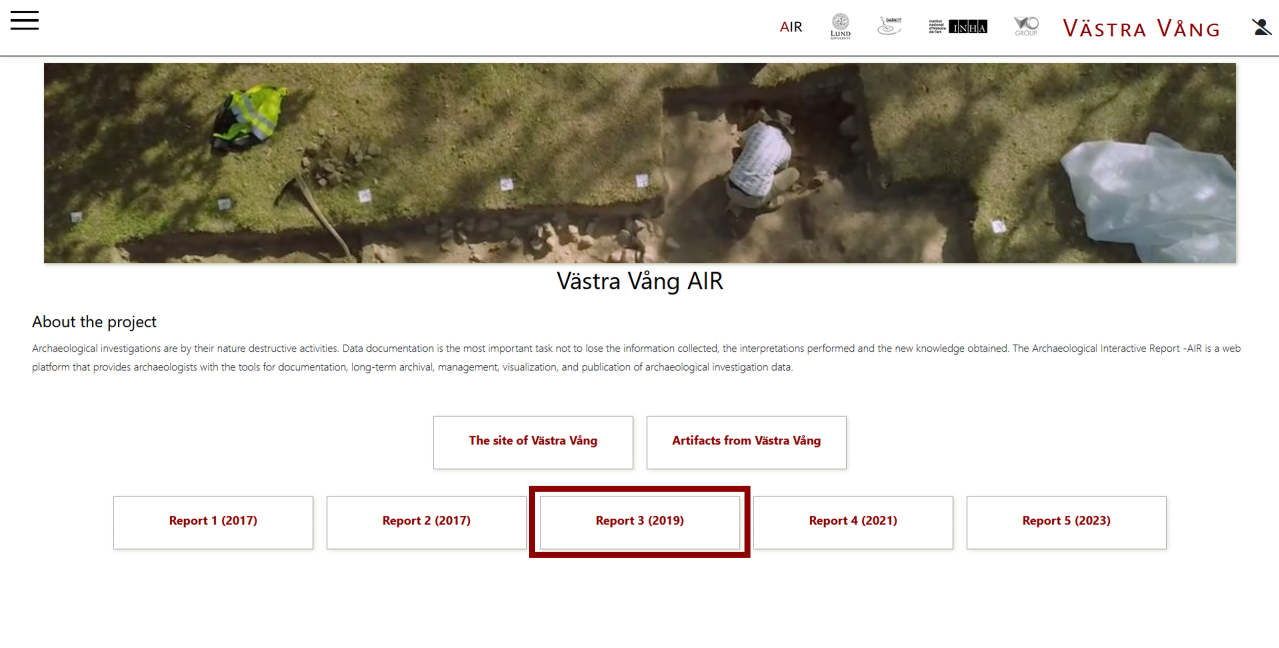
2.1 Click on the site of Västra Vång
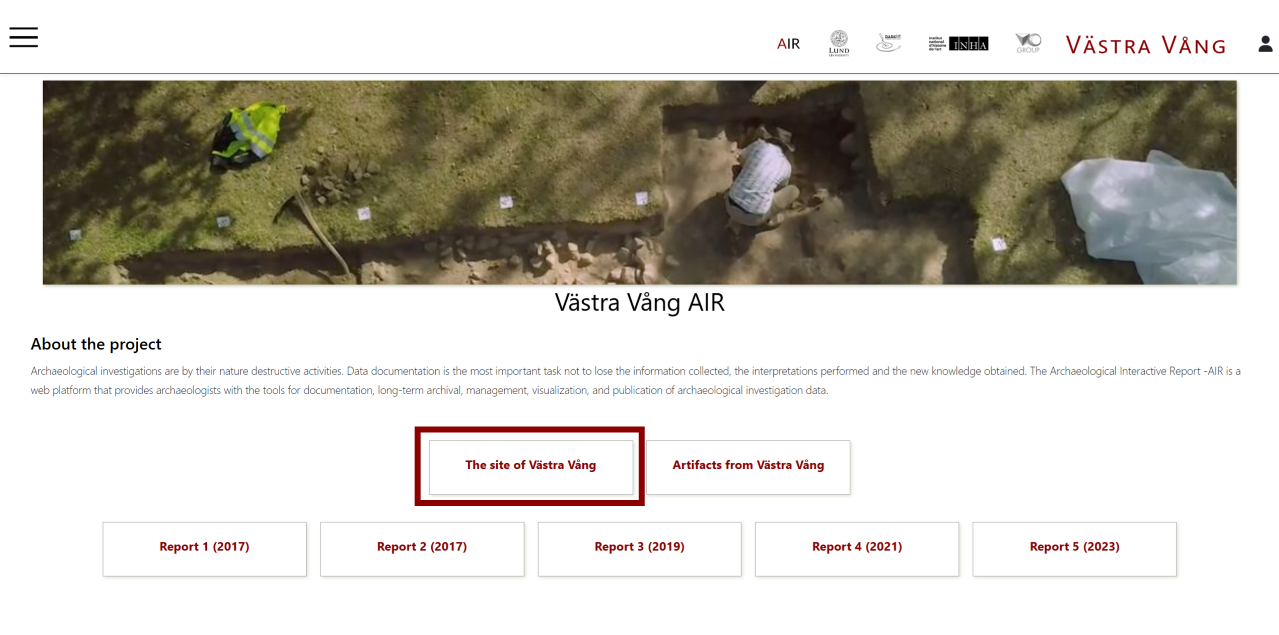
This page provides an overview of the archaeological project, including a short description and direct access to its datasets. From here, users can navigate to different parts of the project using the available buttons and links. The central buttons allow access to key sections of the project. For example, “The site of Västra Vång” leads to detailed information about the excavation areas, while “Artefacts from Västra Vång” provides access to material finds. Below, users can explore the archaeological reports produced.
3. Explore the site trenches from the web mapping
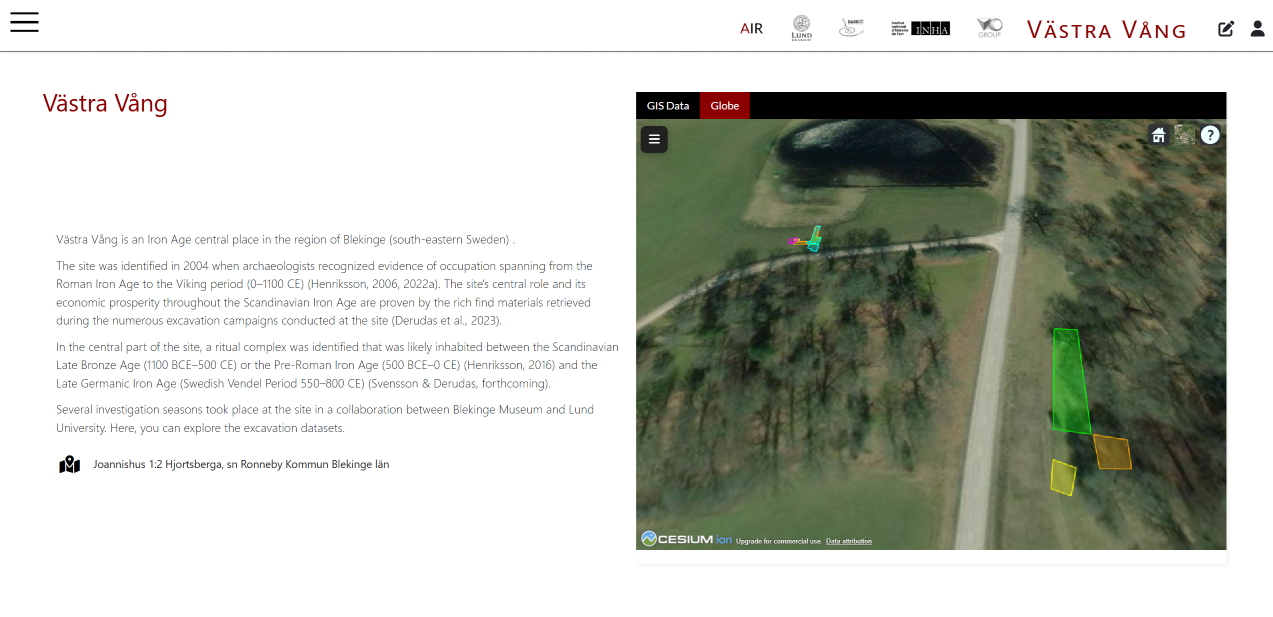
3. ...from the Cesium Globe
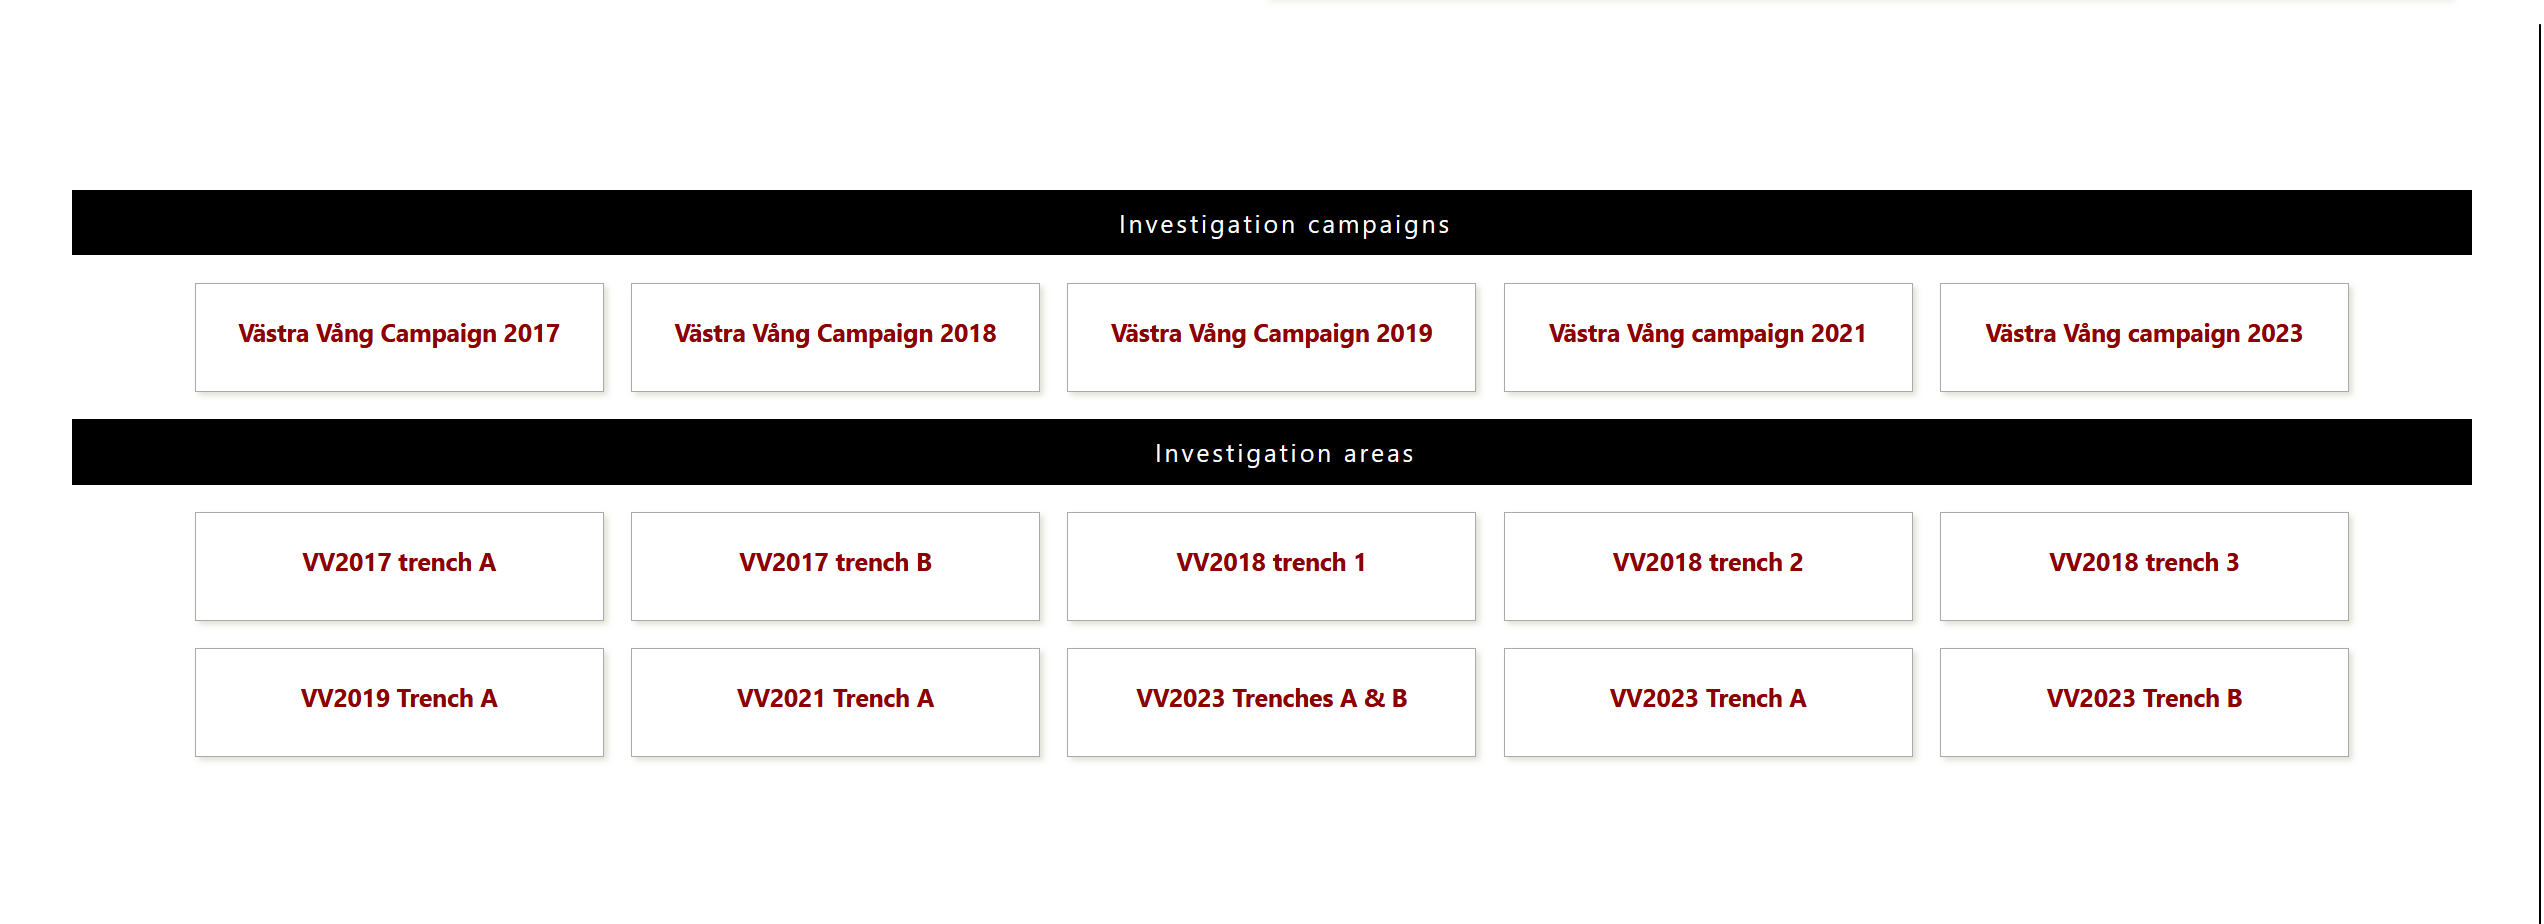
3. ...or from the Contents Containar
In fact, users can access different excavation campaigns and individual trenches by clicking on the dedicated buttons. In this way, navigation can take place both spatially, through the map, and hierarchically, by following the organisation of the project.
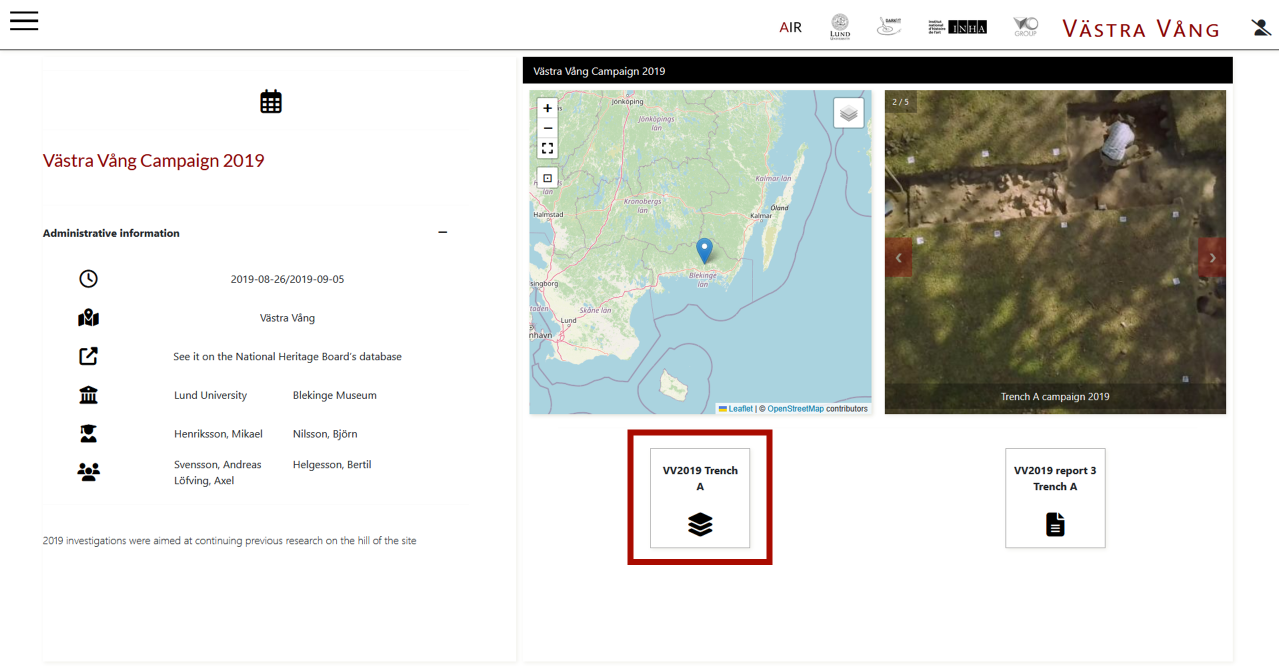
4. Investigation Campaign
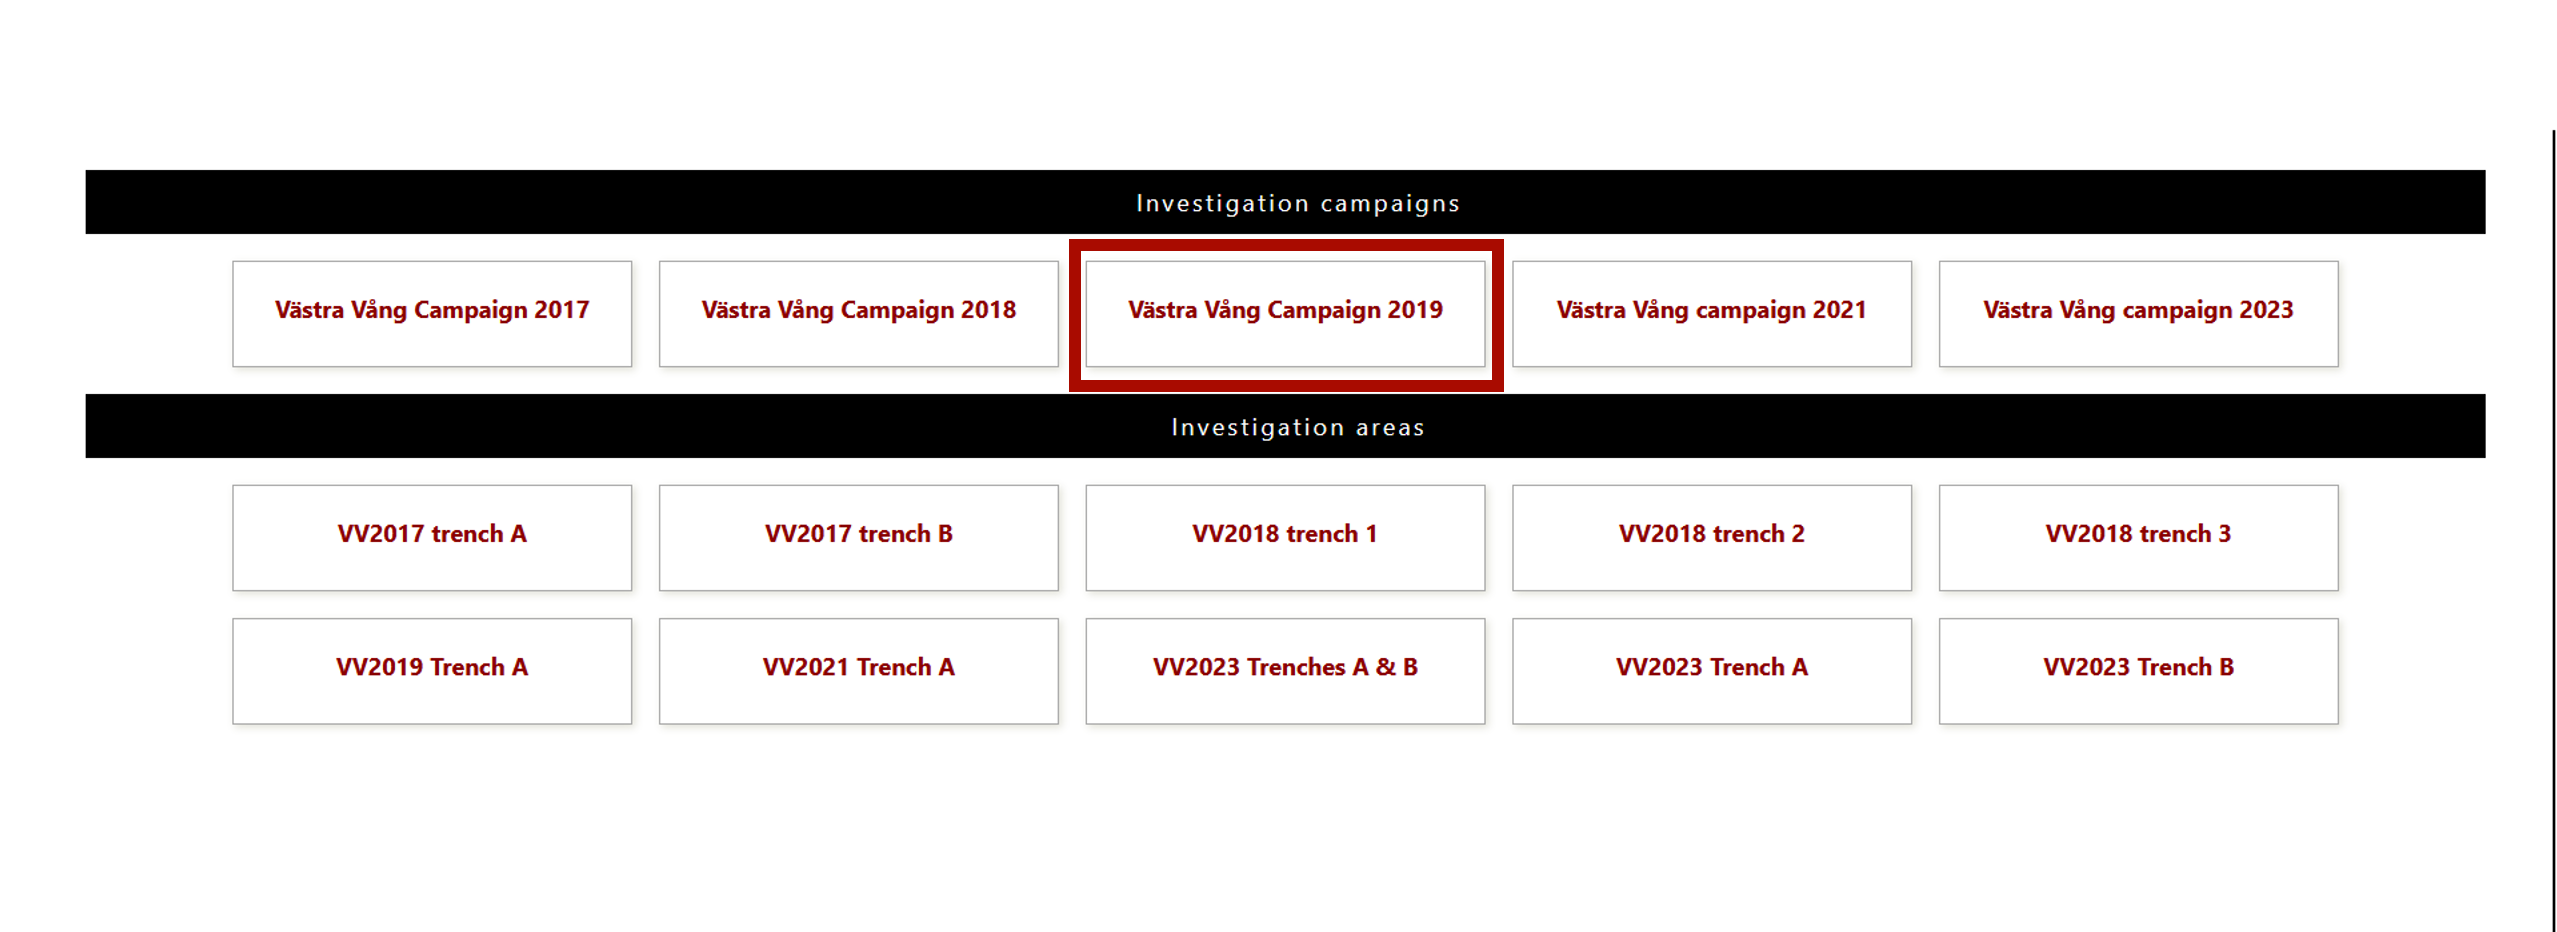
The investigation campaigns represent specific excavation seasons. Campaign pages provide general and logistical information about the excavation, such as dates, participants, and a description of the activities carried out.
From this page, users can access the excavation data through links to trenches or reports.
4.1 Explore the Investigation Campaign
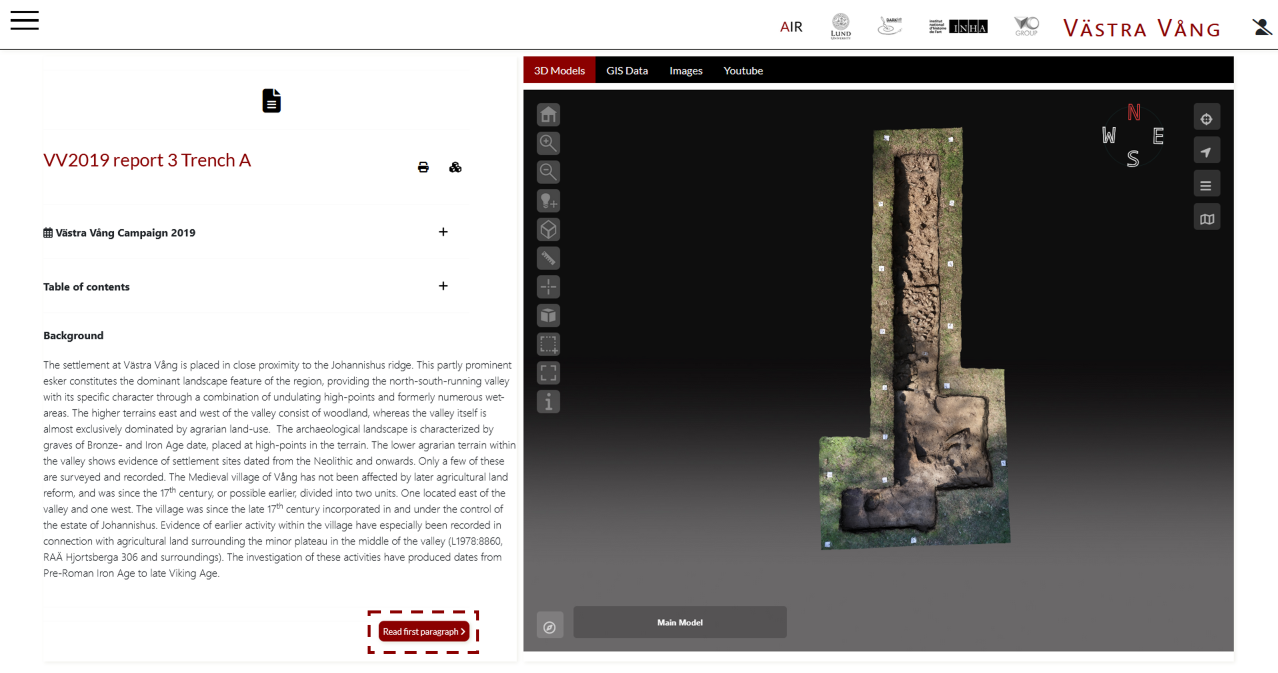
5. Investigation trench
The trench page is the main interface for accessing detailed archaeological documentation within AIR. The trench page functions as a repository for all the documentation and information collected for that specific excavation area. It includes metadata, images, and all 3D representations, which can be explored directly within the three-dimensional canvas. The trench is an informational node that integrates descriptive documentation and spatial visualisation within a single environment.
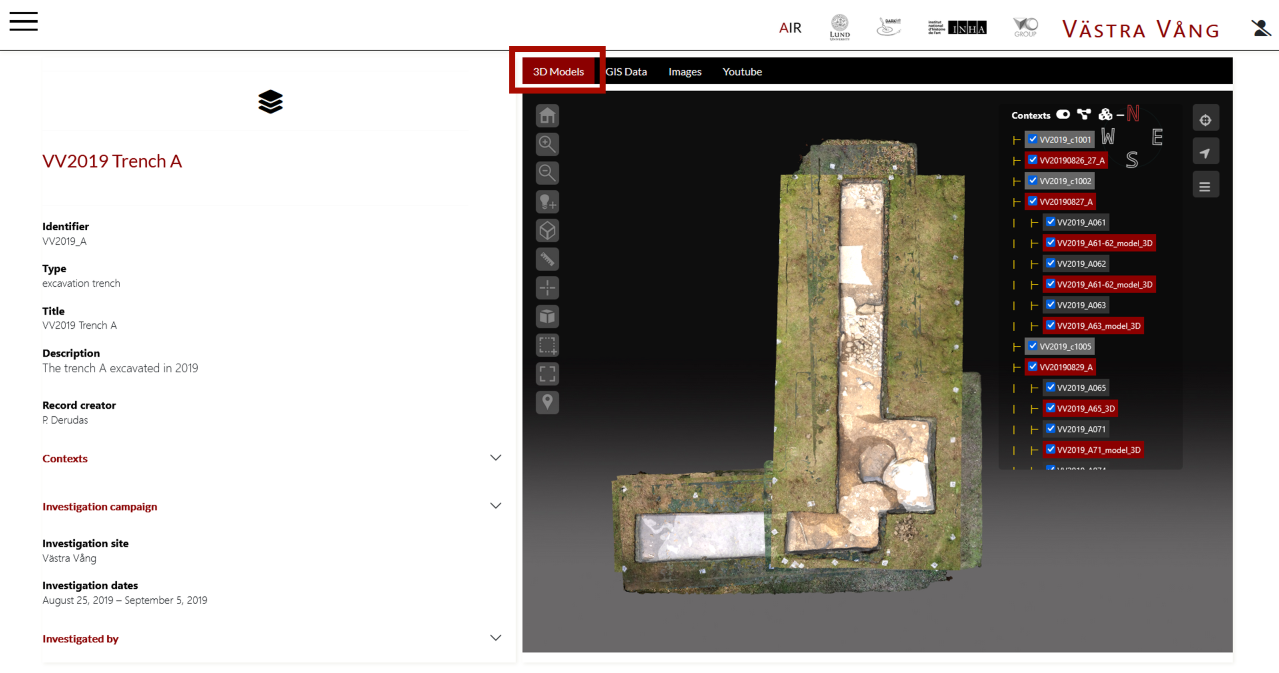
- Explore the trench documentation by scrolling through the page
- Examine texts, tables, and metadata related to the excavation area
- Interact with the 3D models in the canvas to analyse spatial data
Within the 3D canvas, it is possible to adjust the visibility of all three-dimensional components included in the trench record through the layer menu, located in the upper right corner and organized by type. The textured 3D models represent the trench and the finds — in some cases documented in 3D before their removal — and serve as the visual base for the transparent polygons discussed below. The transparent polygons indicate the extent of the stratigraphic contexts, making their spatial distribution immediately readable.
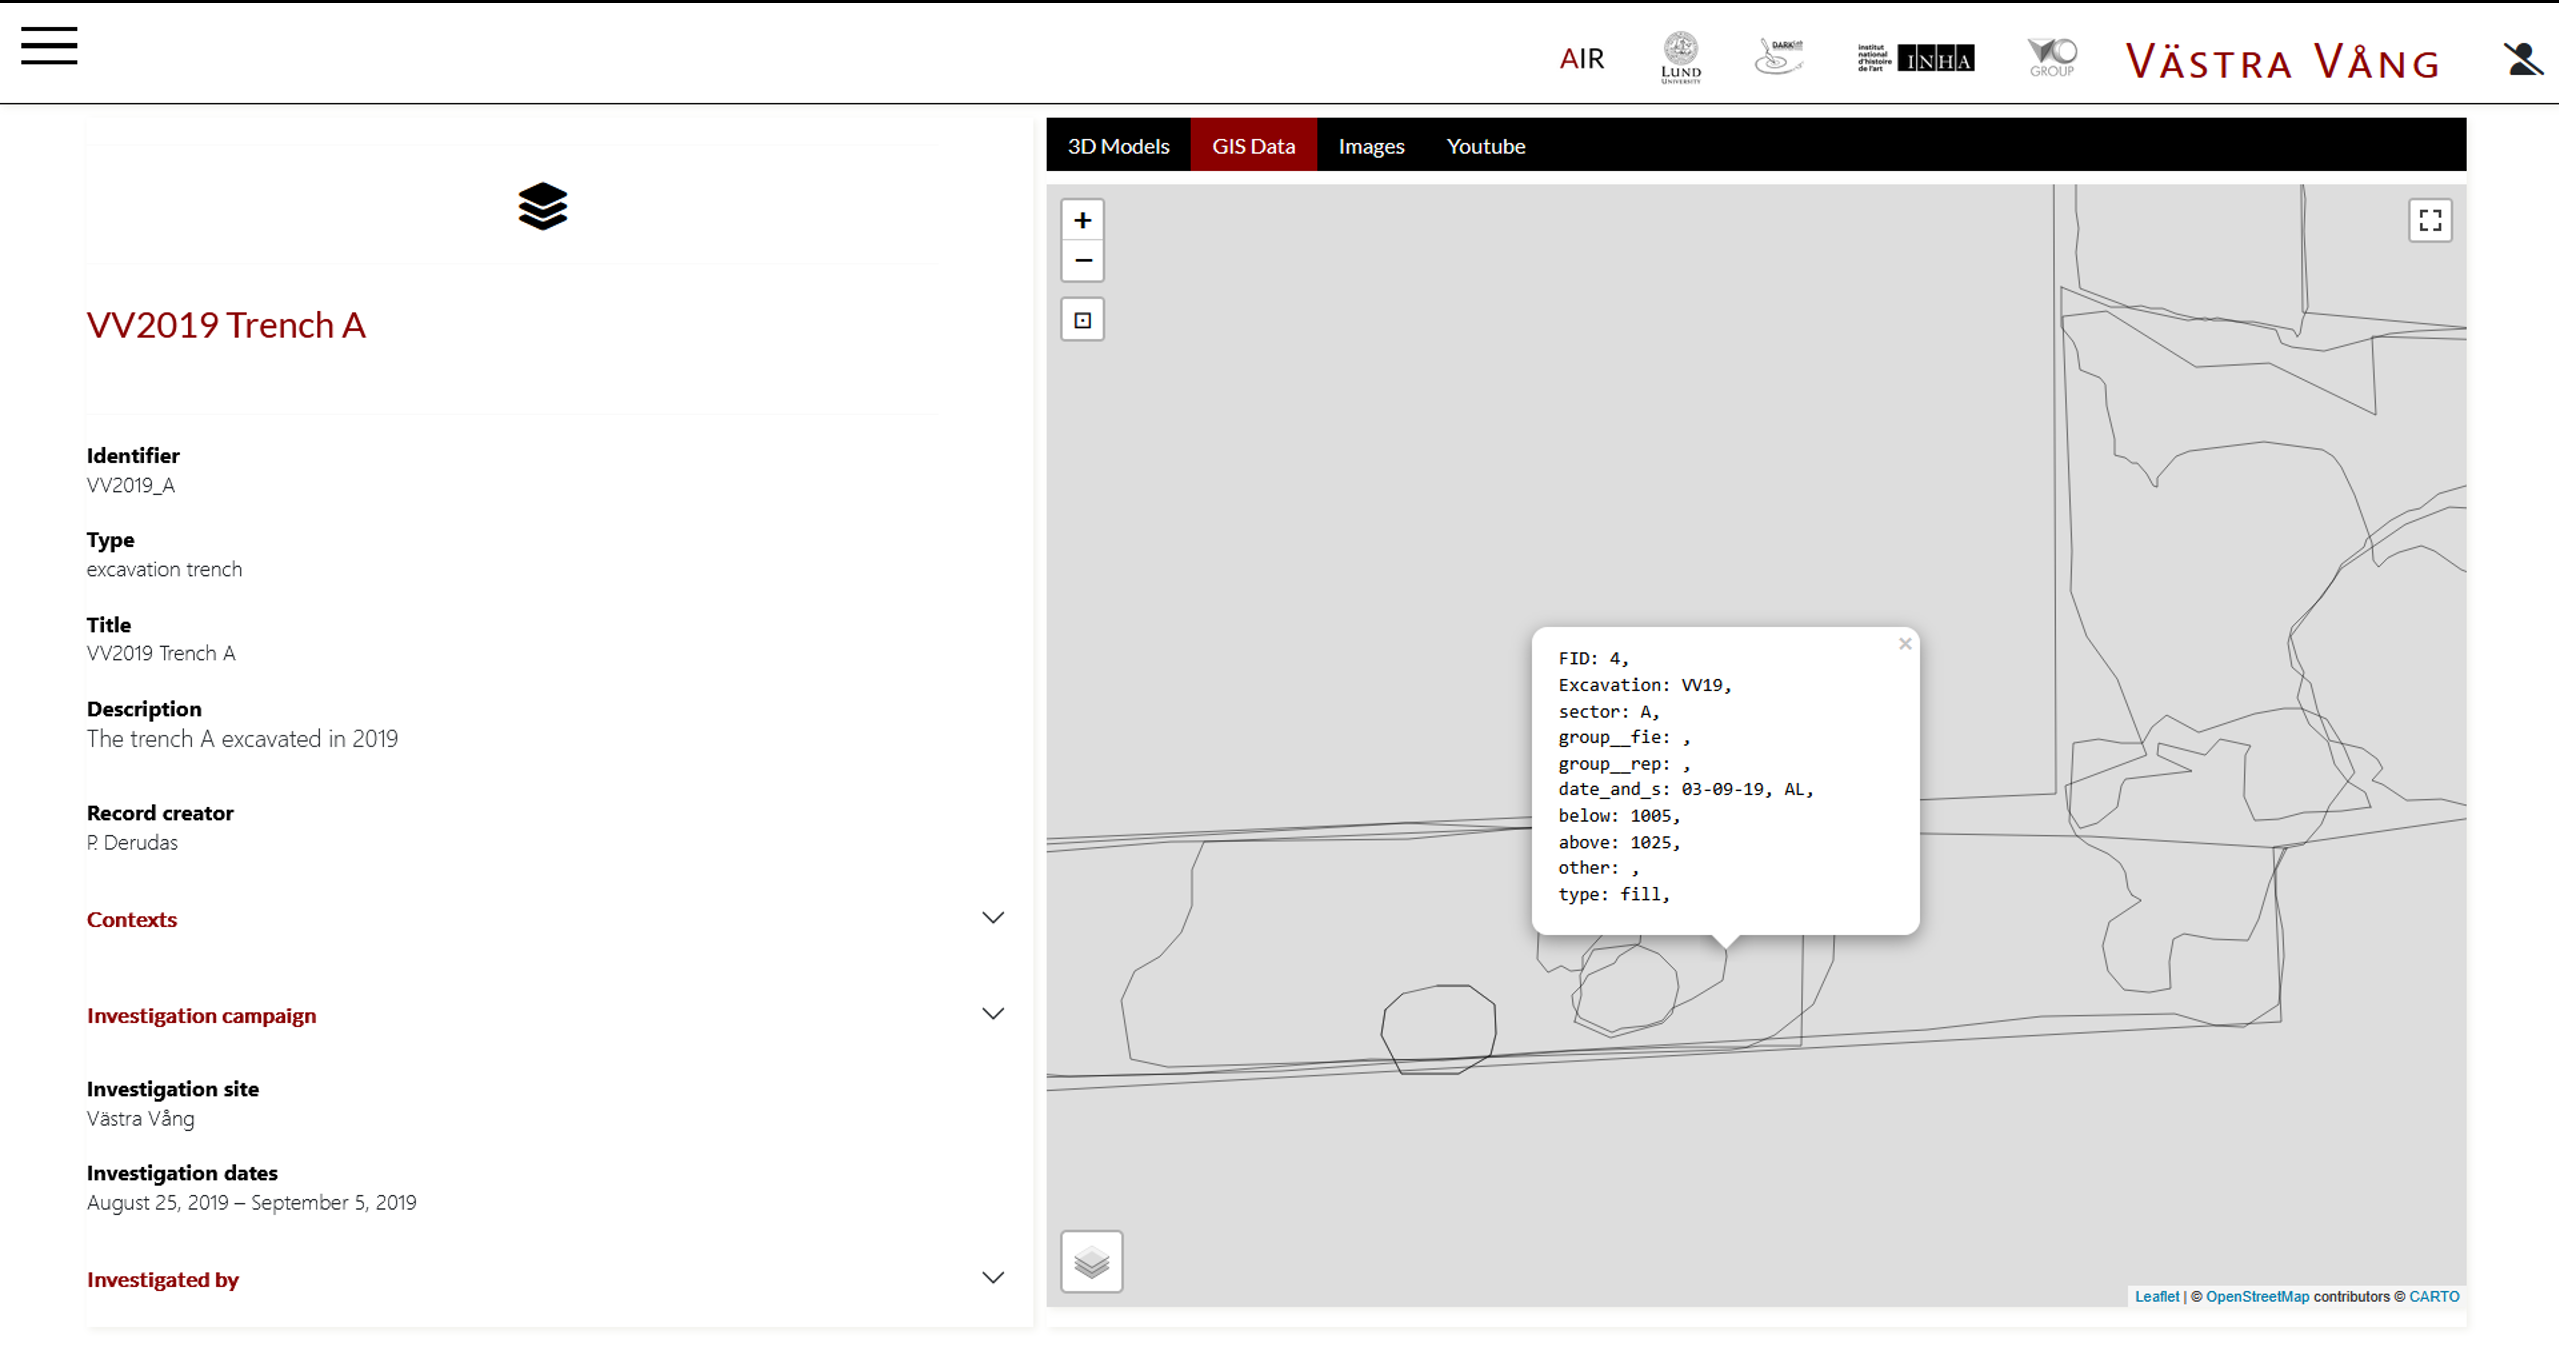
The tabs in the canvas allow users to navigate between the different media associated with the trench, activating and displaying the contents included in the record. In addition to 3D models, the trench also includes other multimedia formats such as images, videos, audio files, and GIS data represented as polygons, polylines, and points. It is important to note that AIR is not a GIS system. It is not designed to replace a GIS, but rather to integrate, visualize, and manage archaeological data, as well as to enable data download — as will be shown in the following section.
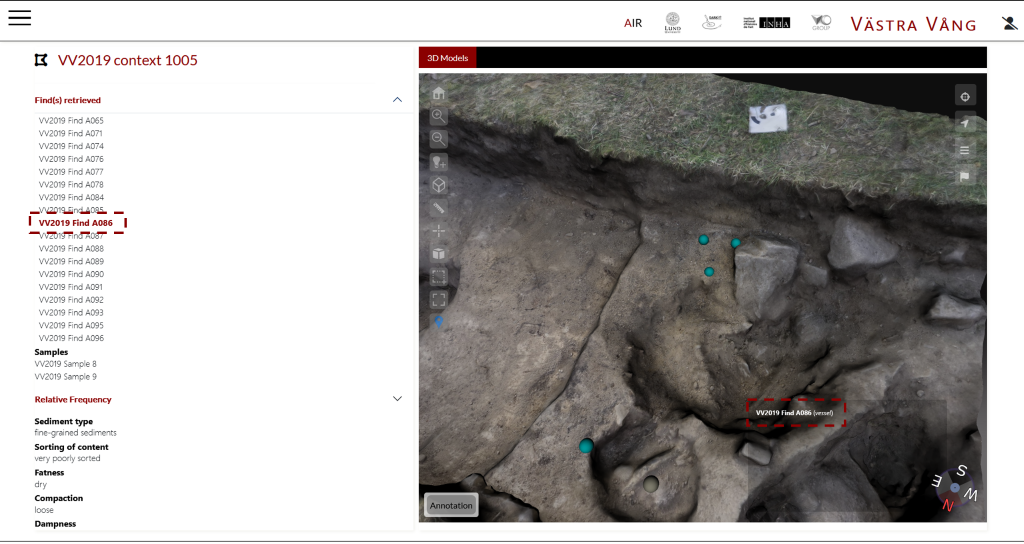
6. Exploring the Context
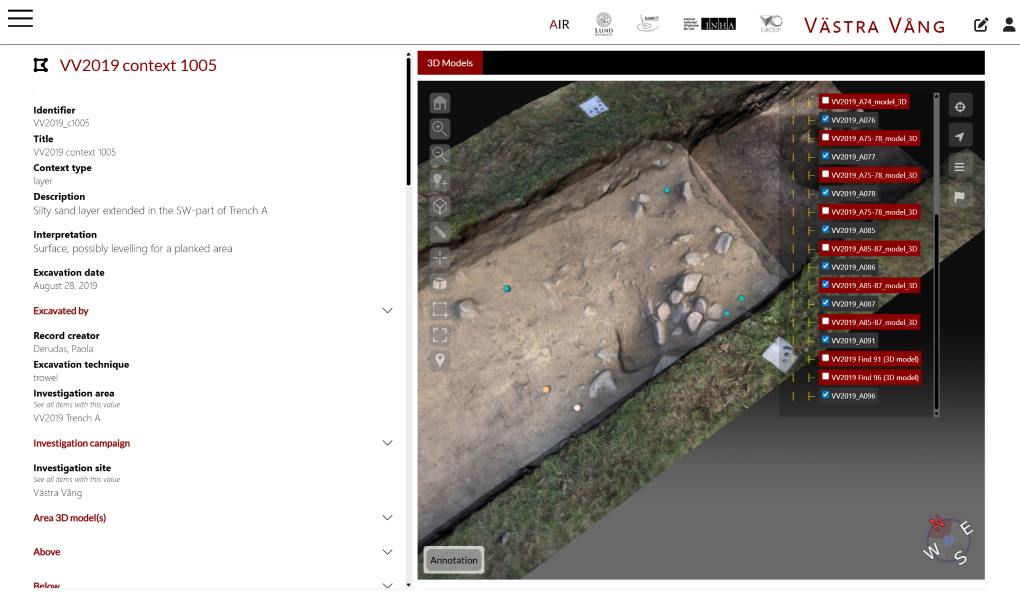
In the metadata section, it is possible to see which components are included in the trench, such as the excavated contexts. These elements can be explored in two ways: by accessing them directly from the metadata section, or by selecting them within the 3D canvas. This dual access — semantic and spatial — is one of the central features of the infrastructure.
- Review the metadata section to identify included components
- Select an element from the metadata list
- Alternatively, select the same element directly in the 3D canvas
Within the context record, it is possible to access information about the finds in two ways: through the metadata section, or directly from the 3D canvas by selecting the element of interest. This allows users to continuously move between descriptive data and its spatial location, while always maintaining visibility of the context of origin.
- Access finds through the metadata section
- Alternatively, select the find directly in the 3D canvas
7. Exploring the finds
8. Archaeological report
Here we enter the narrative dimension of the system. The report allows data to be organised and presented in a structured way, integrating text, images, 3D models, and other multimedia content within a single environment.
The structure of the report reflects that of the documents required by the National Heritage Board.
The data visualization structure is organized into multiple tabs, which allow users to access the different media associated with the report — including 3D, GIS, images, video, and audio.
However, the reading of the report is closely connected to the 3D models. The text is not separated from the spatial and visual dimension, but continuously interacts with it: 3D models are the core around which the narrative is constructed.
In this way, interpretation develops in direct relation to the documented space, transforming the report into an interactive and contextualized reading environment.